


Updated November 2026
The 2025 Spiro report splits the effect of live events into awareness, consideration and conversion, and finds the largest shares at the late stage of a decision. These are survey answers from US attendees, so they indicate direction, not a guaranteed result in Canada.
Why the funnel view is useful for event planning
Canadian organisations run events in short windows: winter carnivals, summer festivals, Canada Day, hockey and lacrosse seasons, trade fairs in Toronto or Montreal, and school or corporate calendars in both English and French. With a short window, it helps to know which part of a customer decision an event can actually influence.
One 2025 survey is built around exactly that question. We opened the source, and the sections below report what it states, then compare it with older industry data and academic work.
Because a calendar of events is the main marketing asset for many Canadian clubs and businesses, a single well-aimed appearance is worth planning around evidence, even when the evidence comes from a neighbouring country.
Awareness, consideration and conversion in the Spiro report
The Experiential Marketing Impact Report by Spiro, released in Las Vegas on 3 September 2025, is based on a proprietary survey of more than 2,000 consumers who attended technology and consumer goods live events in the United States.
Awareness
Among technology attendees who had no earlier contact with the brand, 91% said they would now consider it.
Consideration
68% said the live event made the brand's difference from others clearer.
Conversion
82% said the event helped confirm or speed up a purchase decision they had already begun to make.
The pattern is worth noting. The strongest share sits at confirming a decision, which suggests events work as a reinforcement for people already leaning toward a brand. The same report says attendees who called the experience memorable, valuable and trustworthy were nearly three times more likely to buy than those with neutral impressions.
Funnel language is common in marketing, but the survey wording matters. The report asks attendees what they would now do or what the event helped them do, so each stage is a self-description. A person who says an event clarified a brand's difference is reporting a feeling of clarity, and the report does not check it against what the brand actually offers. Planners can still use the three stages as a checklist for what their own event is meant to achieve.
Older benchmarks from the events industry
The March 2013 BizBash report on EventTrack, from the Event Marketing Institute and the agency Mosaic, stated that 95% of consumer respondents felt more inclined to buy after a recent event, that 52% bought the product marketed at an event they attended and that 54% bought it later. It adds that 71% named sampling or a demonstration as influential. We read a news summary and not the original study.
A year later, an Entrepreneur article, 2014 repeated the 96% inclination figure and a 74% share with a more positive opinion of the brand, and added a comment from Brand Keys that most categories lean about 70 to 30 toward emotional over rational decisions. That last number is an estimate from one consultant, not a study.
Taken together, the two trade-press summaries describe a pattern that the 2025 survey echoes: attendance, a good impression and a later purchase tend to go together in what people report. Because the older figures reach us through news articles, they serve as context and not as proof, and we give the 2025 report more weight since we could open it directly.
Limits and method
The Spiro sample is American and limited to two sectors. The percentages answer questions asked after the event, among people who chose to attend. No result here separates the effect of the event from the preference that brought someone through the door. Conference-style numbers also say nothing about francophone audiences, regional events in Quebec or about winter outdoor conditions. A commonly quoted 85% figure was not traceable to a primary report and is excluded.
Other work points in a similar direction. The Set Creative research summarised by Conference News in 2019 reports that 73% of consumers in the United Kingdom and United States said they were more likely to buy after taking part in a live brand event, and in the same coverage 82% said they want brands to entertain, engage and educate them. A 2021 study in the Journal of Advertising adds field data from 340 aquarium visitors and 396 fashion show attendees, and finds that perceived event quality drives purchase intention more than expected entertainment. For a Canadian festival, a visitor who judges the day well run is more likely to be favourable toward the sponsor than one who simply expected fun.
What this changes for Canadian teams, events and companies
The funnel view suggests choosing a goal before choosing a format.
- For awareness at a festival or fair, a character that draws people in matters more than a long message.
- For consideration, give the mascot something to explain, such as a team crest or a product theme.
- For conversion, link the visit to a simple next step, for example a sign-up for the season.
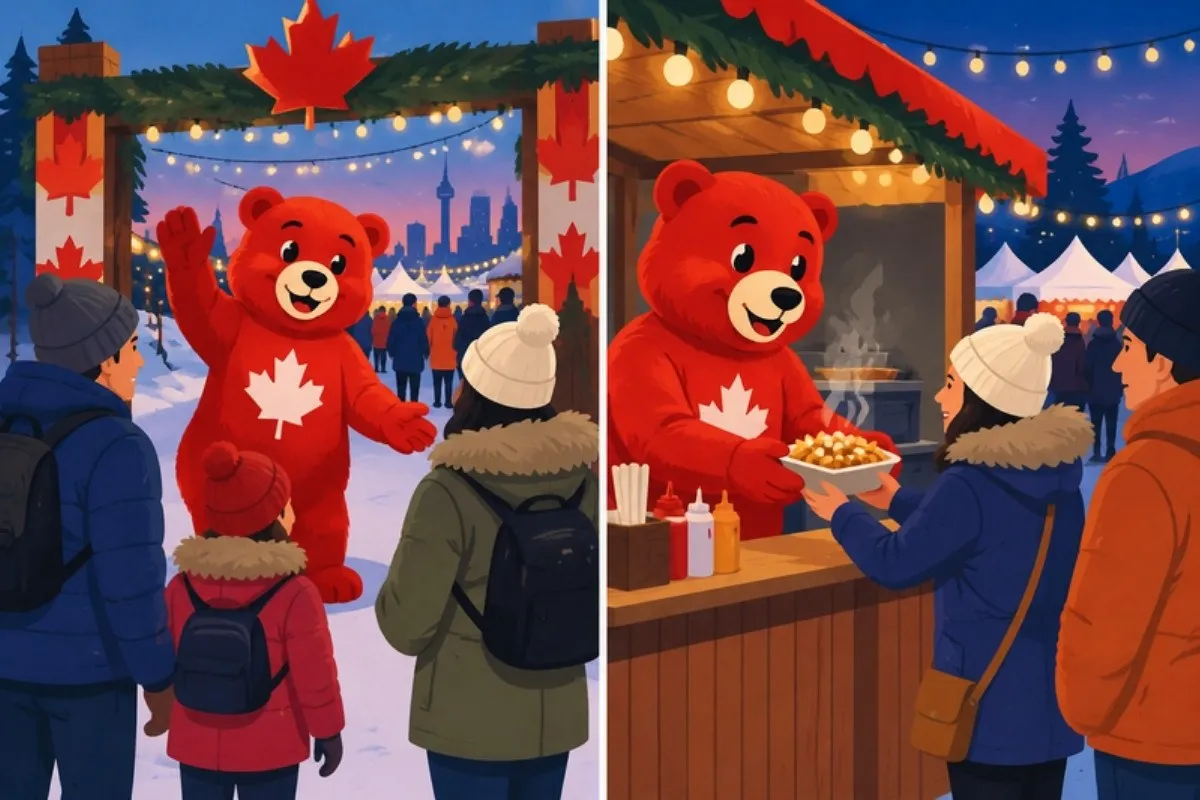
A mascot designed for outdoor use in cold weather, and for bilingual signage in English and French, fits the practical conditions of Canadian events. Nothing in the surveys promises a given result; they support the more limited idea that a visible, friendly presence helps people remember who you are.
Seasonality adds one more consideration. An event held in January at minus twenty degrees draws a different crowd from one in July, and a survey of conference halls cannot tell us how those crowds respond. A sensible plan therefore treats the first season as a test, records the same simple measures each time and compares seasons rather than relying on borrowed percentages.
Sources
- Spiro, Experiential Marketing Impact Report, 2025
- BizBash, EventTrack 2013, 2013
- Entrepreneur, EventTrack coverage, 2014
- Conference News, Set Creative survey, 2019
Frequently asked questions
What share of attendees moved toward a purchase in the Spiro report?
82% said the event helped confirm or speed up an existing purchase decision, 68% said it clarified how the brand differs, and 91% of new-to-brand technology attendees said they would consider it.
Does the data cover Canada?
No. The Spiro sample is more than 2,000 United States attendees, so Canadian results could differ.
Why not quote the 85% figure?
Because it could not be traced to a primary report.
Is the Brand Keys 70 to 30 ratio a study?
No, it is an estimate quoted in a 2014 article.
How should a team measure an event?
Pick one stage of the funnel, such as sign-ups or enquiries, and compare before and after the event.
Read also
- Canada and the Americas in the 2025 advertising figures
- Out-of-home in Canada and North America in 2025: what the numbers mean for events, teams and seasons
- Event marketing studies and what they mean for Canadian teams, festivals and businesses
- Guerrilla marketing research in plain terms: what Canadian event organisers, teams and businesses can use
- Mascots across Canadian events, teams and seasons: how solid is the research?
- The Duolingo owl as a case study for Canadian events, teams and seasonal campaigns
- Vetting a marketing number for a Canadian team, festival or business